PricedInBitcoin21 | Compare Financial Assets in terms of Bitcoin
Platform to make people aware about the amazing investment opportunities cryptocurrencies like Bitcoin.

The Challenge
Most investors measure performance in USD. PricedInBitcoin21 flips that: it lets users see how the same assets look when priced in Bitcoin, exposing how much purchasing power fiat-denominated returns have quietly surrendered over time. The core technical problem was data sourcing — most third-party APIs only publish fiat prices, and relying on them entirely introduced reliability risks. The platform needed to operate independently of any single data source, cover over 200 assets, and keep prices current throughout the trading day.
What We Built
Multi-Source Data Pipeline
The platform collects USD prices from multiple third-party APIs, converts them to BTC and SAT values, and stores everything for later analysis. Custom calculation and scheduling algorithms absorb roughly 1 million new data points per day. The dataset now stands at 10 million data points going back 15 years, covering major categories: Fiat, Stocks, Bonds, Crypto, and FRED (Federal Reserve Economic Data).
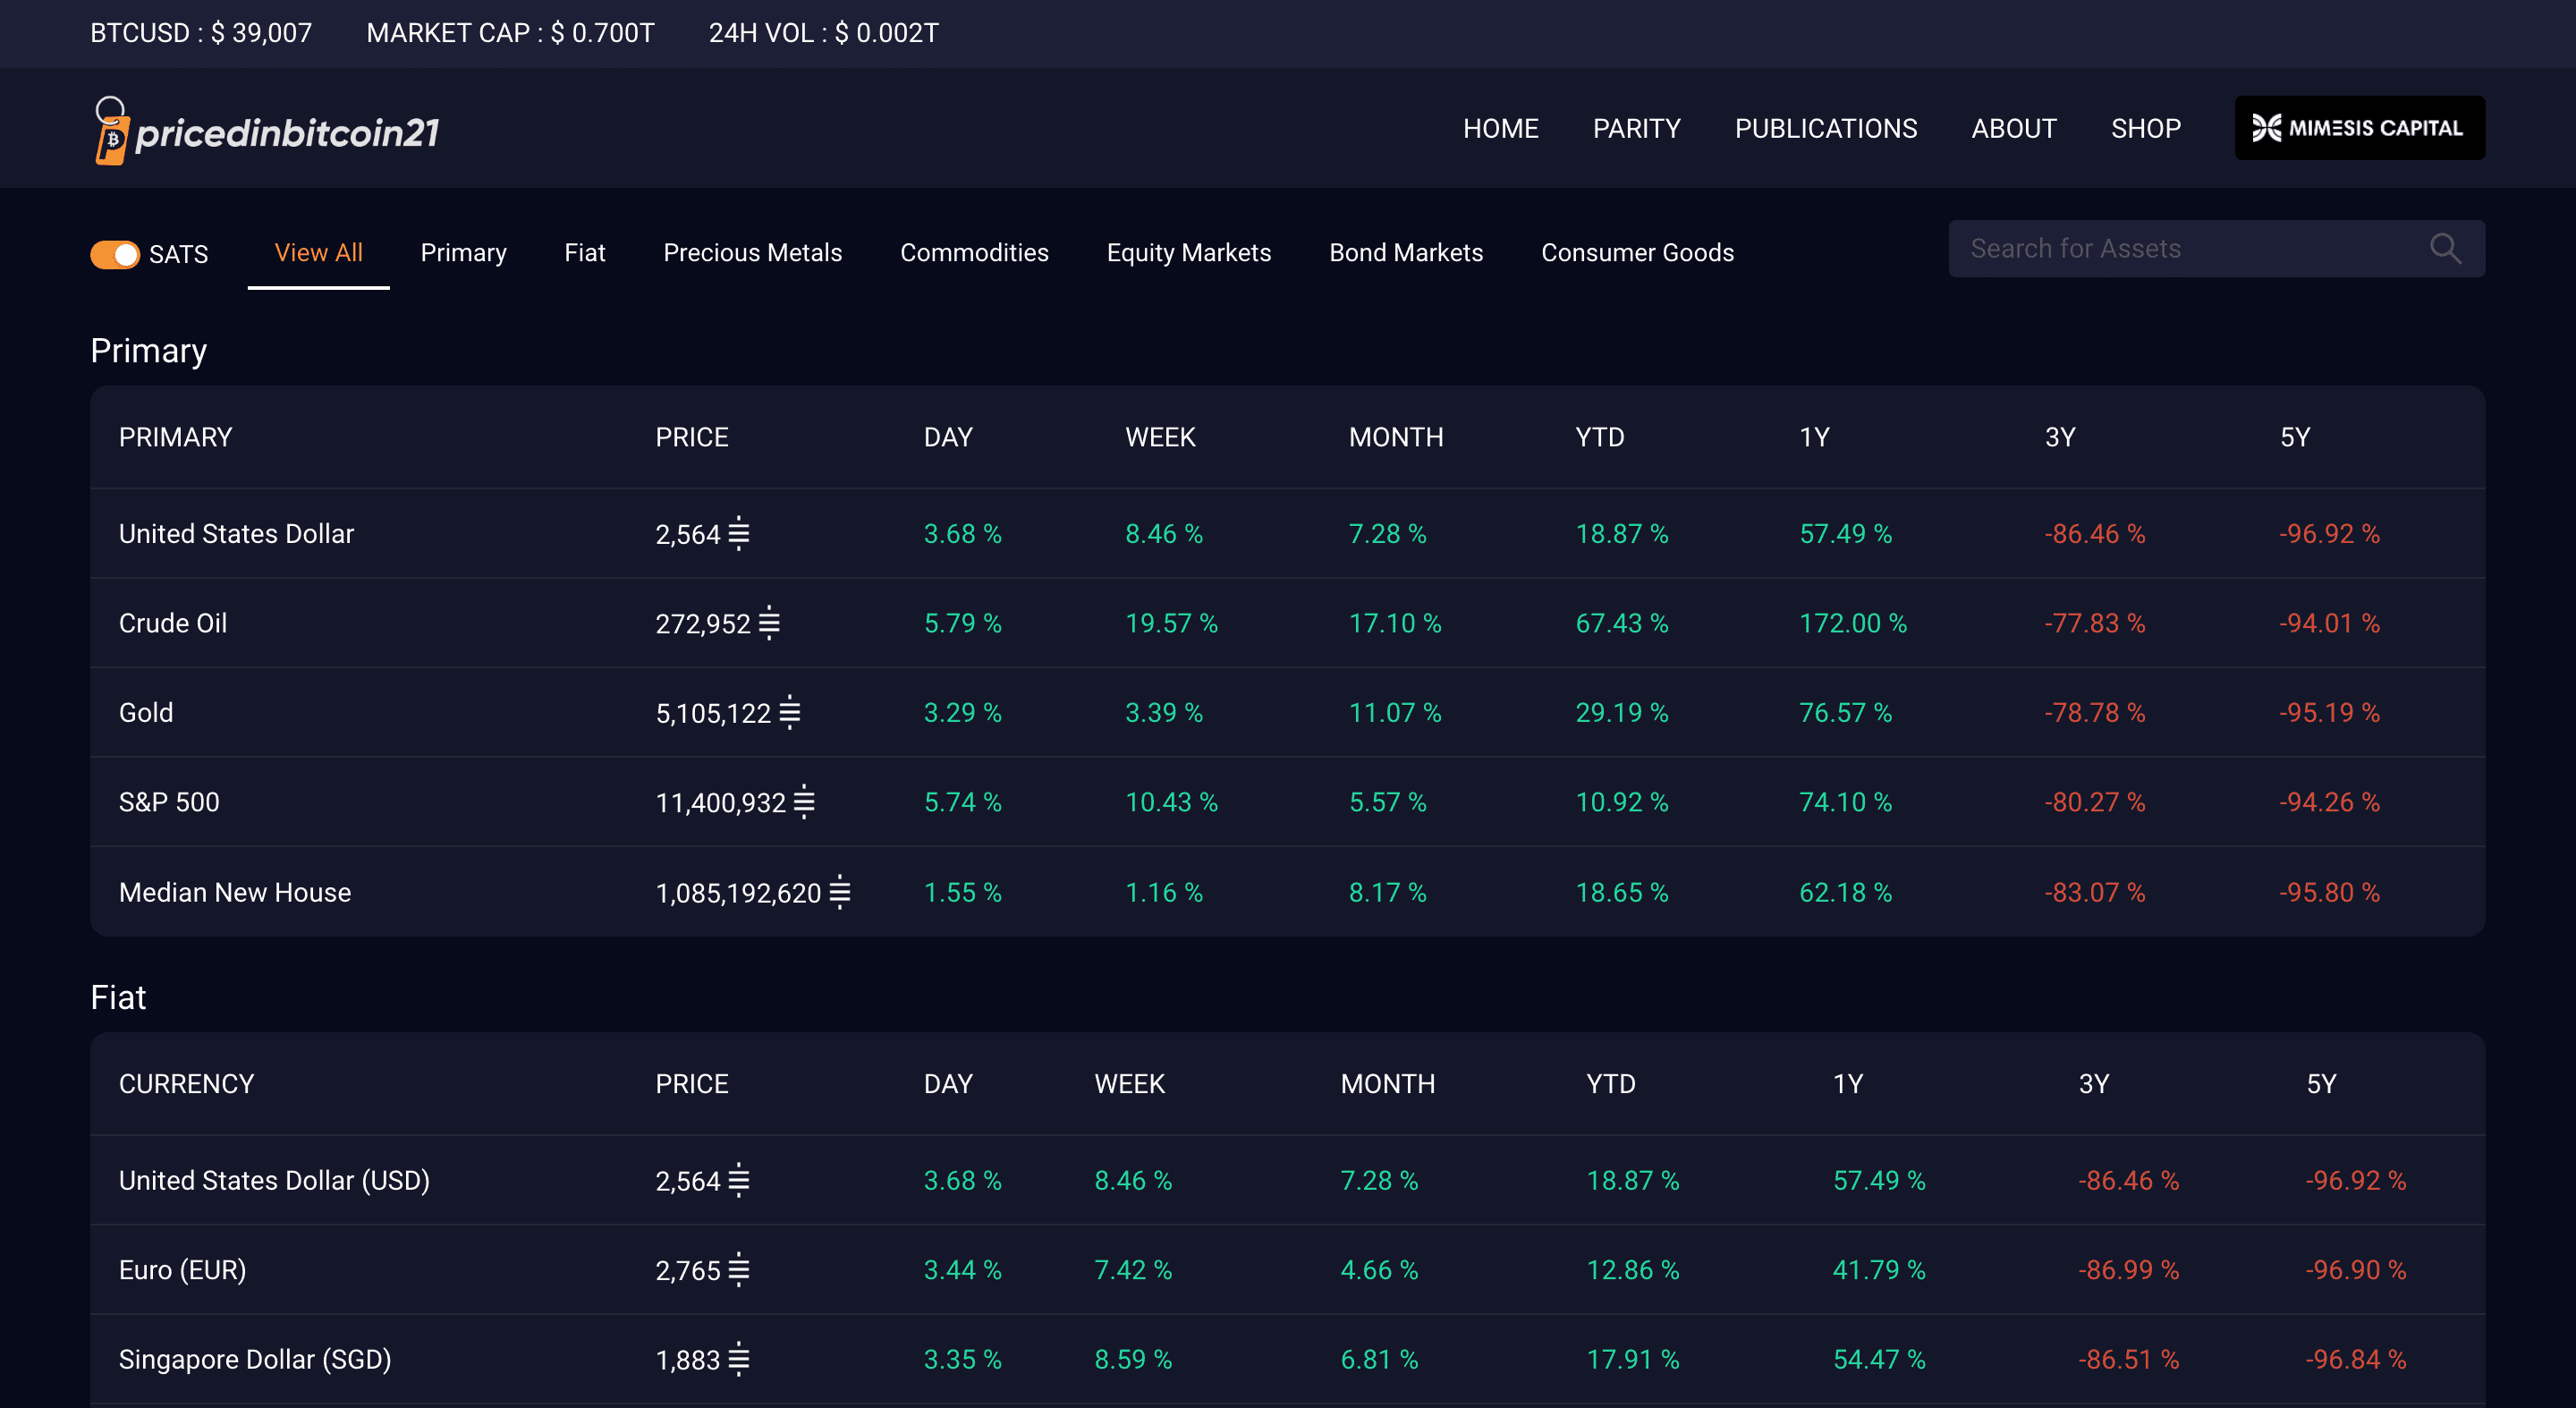
Interactive Asset Tracking and Charts
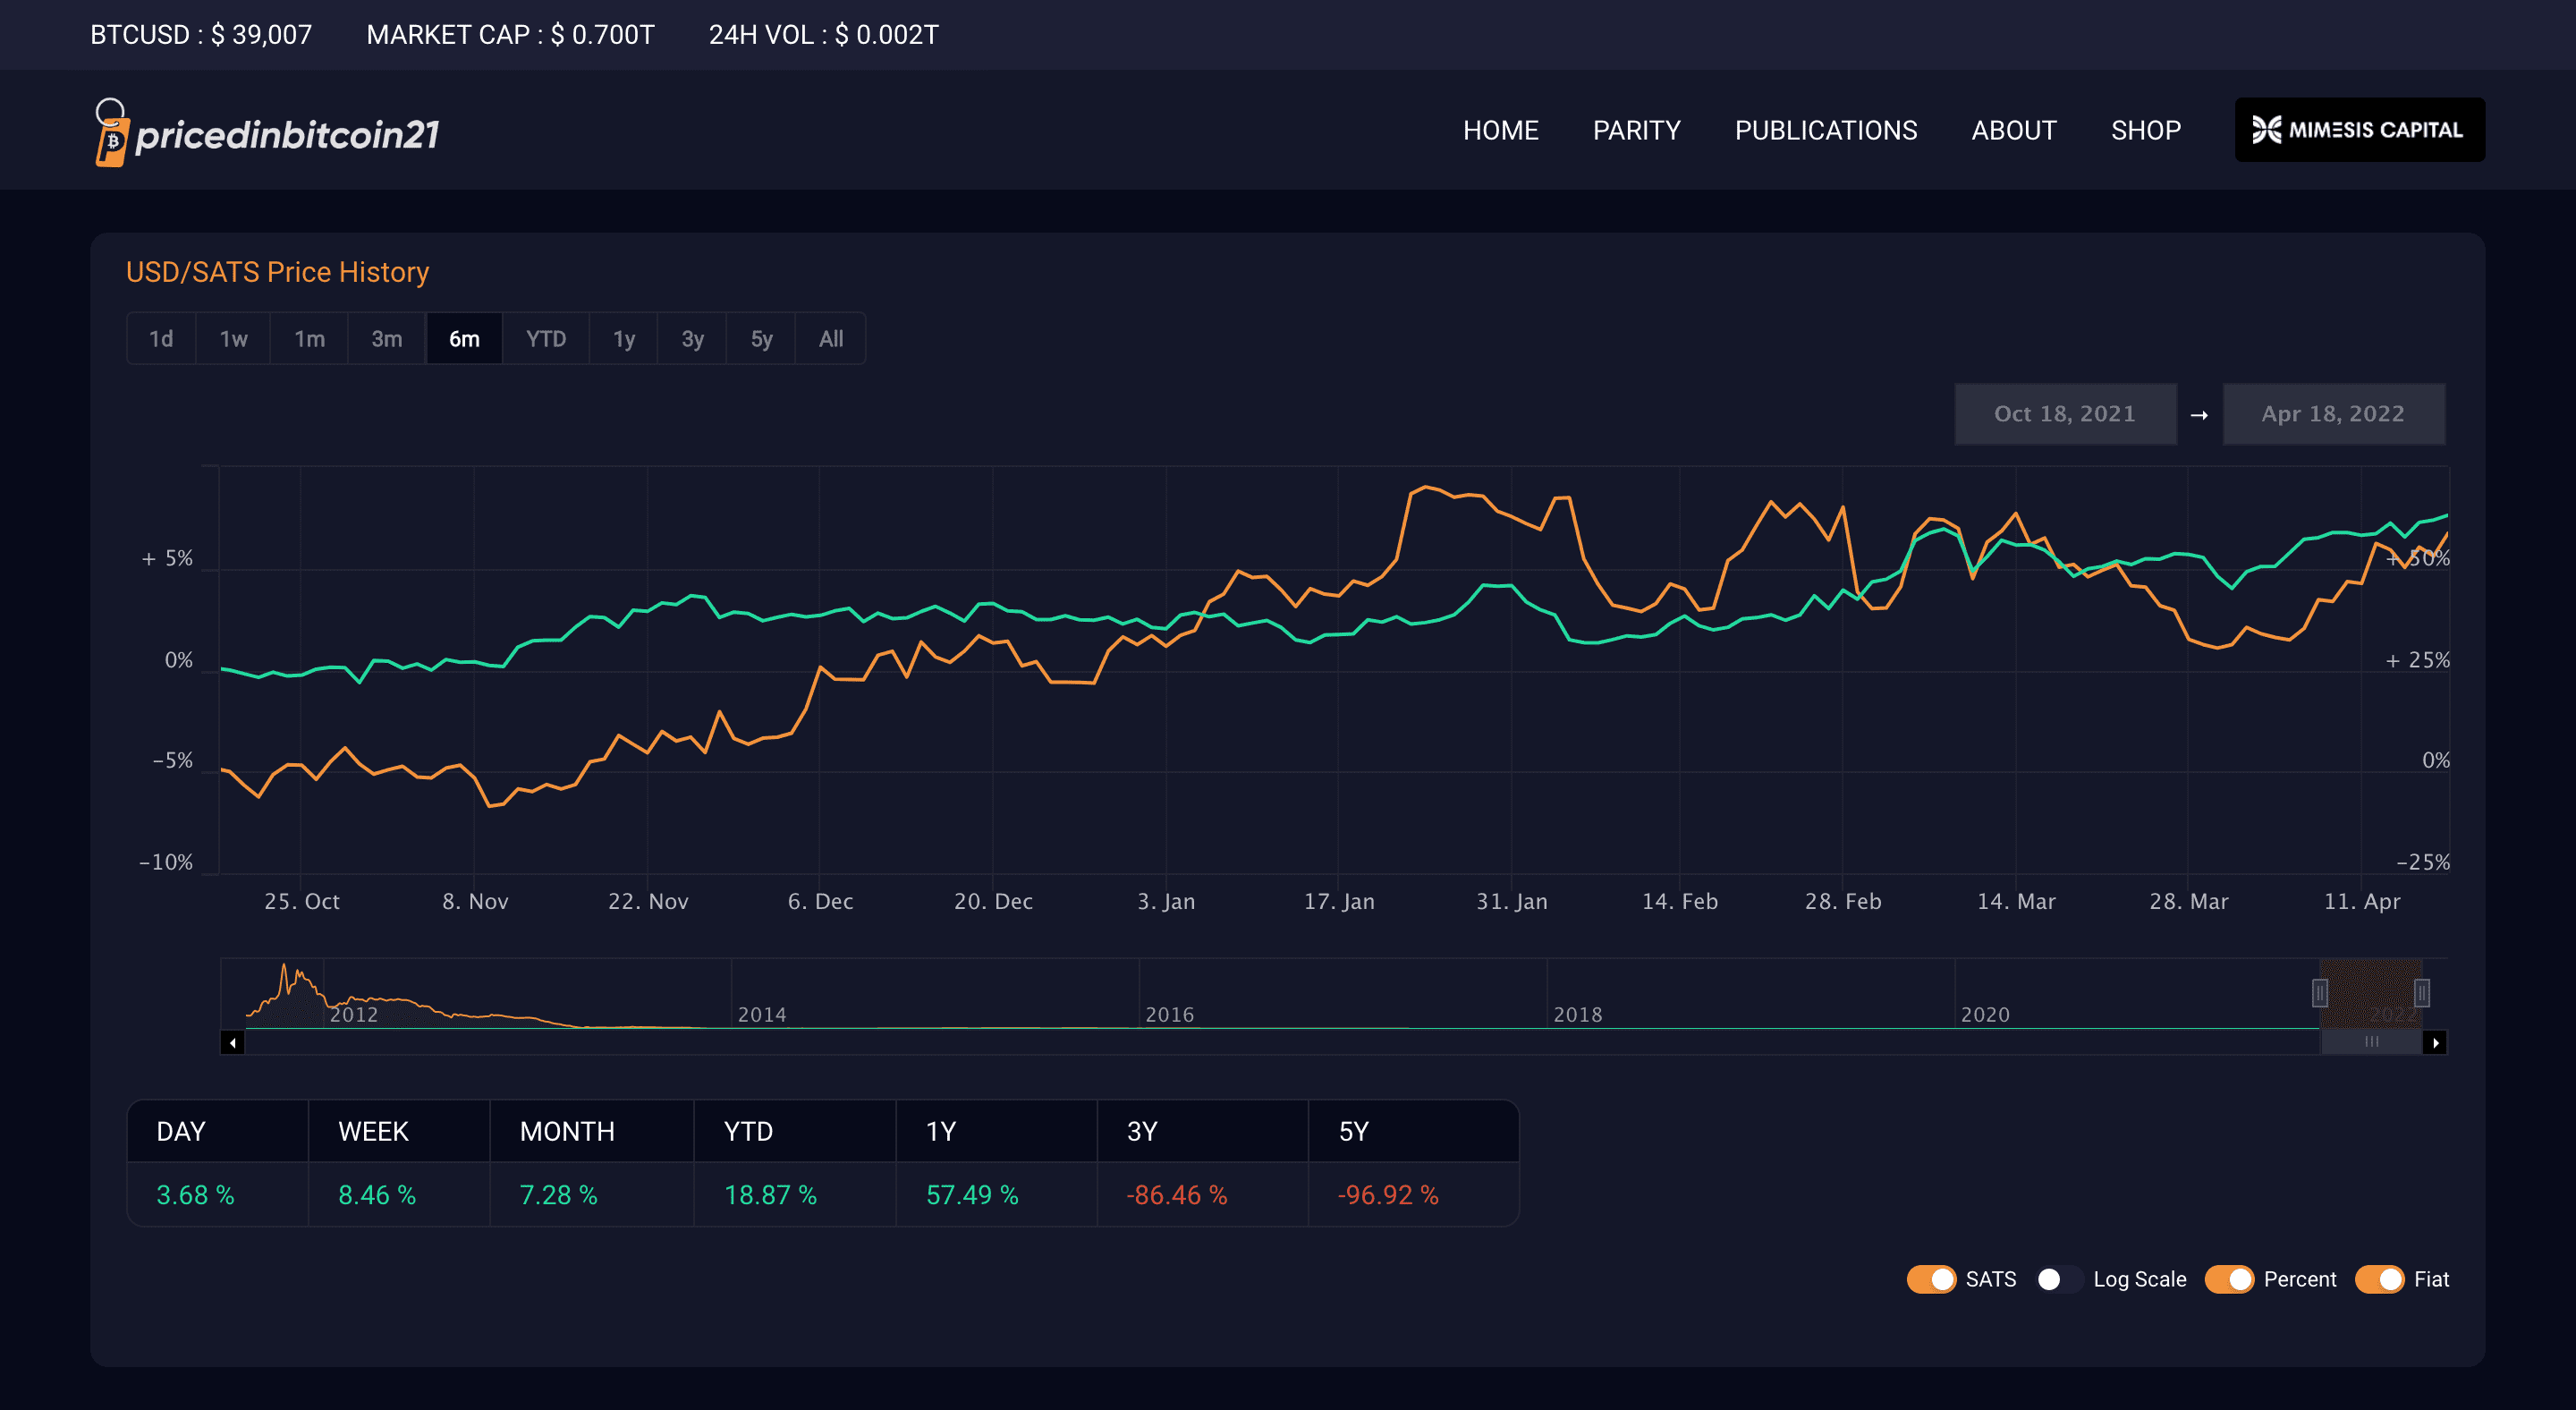
Users can track fiat currencies, stocks, indices, and other asset categories against Bitcoin and Satoshi. Interactive ratio charts can be set to any time range from a single day out to 10+ years, and they update every minute as new price data arrives — so the comparison stays current throughout the trading day.
- 10–15 years of historical data for comparison
- Visual tracking of asset/Bitcoin ratio charts from 1 day to 10+ years
- Price refresh every 1 minute
Admin Panel
A backend admin panel gives admin users direct control over price data and blog content, and handles error correction when incoming data contains miscalculations.
The Result
PricedInBitcoin21 launched with a self-sustaining data pipeline ingesting over 1 million data points per day, a 15-year historical dataset covering 200+ assets, and interactive charts that update every minute. The MERN stack powers the full application, with Node.js handling scheduled data-collection jobs and MongoDB storing the time-series price records — all running on Heroku without manual intervention.